


For Biocore, we utilized advanced technologies like React and Redux for the frontend, integrated custom APIs, and employed robust data visualization tools. Our team delivered a scalable and responsive web application that significantly enhanced the efficiency of biomechanical data analysis. The services provided included full-stack development, UX/UI design, and comprehensive quality assurance, ensuring a high-performance solution tailored to Biocore’s needs.


The client’s mission is to increase the safety of athletes in injury-prone situations. They approached us with an initial vision of the product characterized by visual attractiveness, data readability, and scalability. The customer supplied low-fidelity screens, the app’s backend, along with the ready AWS setup and APIs, so our task was to develop the frontend for the desktop application.
One of the challenges we assumed was transposing raw biomechanical readings from impact sensors into readable and user-friendly data visualization dashboards. Another one was to create a future-proof and scalable solution, ready for new add-ons. Additionally, the design needed to facilitate the ability to white label the software at a later date.
The discovery phase revealed the users’ needs and functional expectations. A deep dive into the client’s sports niche during online workshops with domain experts and stakeholders allowed us to identify and create the product as it was envisioned.
The scope of work, executed by Merixstudio’s experts working in the dedicated team model, included:
The client reached out to Merixstudio thanks to the referral from their Product Owner, who worked with us in the past. To effectively transpose the requirements into a usable product, we followed the Scrum methodology with nine sprints in total. The 6-person project team covered all the bases starting from the introductory kick-off meeting through the workshop sessions during which they learned about the logic of the application and the requirements to facilitate effective execution.

The core of the proposed solution involved the frontend based on TypeScript and Next.js, with highly visual graphs presenting the biomechanical engineering data aggregated in the platform extended by videos recorded from different perspectives. This combination ensured easy maintenance of clean code as well as integration of object types in compliance with the GraphQL Schema API. The Apollo GraphQL client implemented is a top fast delivery platform that enabled faster time to market. We also took advantage of the Jest.js testing framework, manual tests, and the React Testing Library for unit tests to limit the number of mistakes and facilitate faster change implementation.
To cater to the data presentation requirements, we used Three.js for 3-D model creation. The Material-UI library in React helped to achieve a neat visual presentation quickly. It also ensured that users could take full advantage of touchscreens in case a mobile version was created in the future.
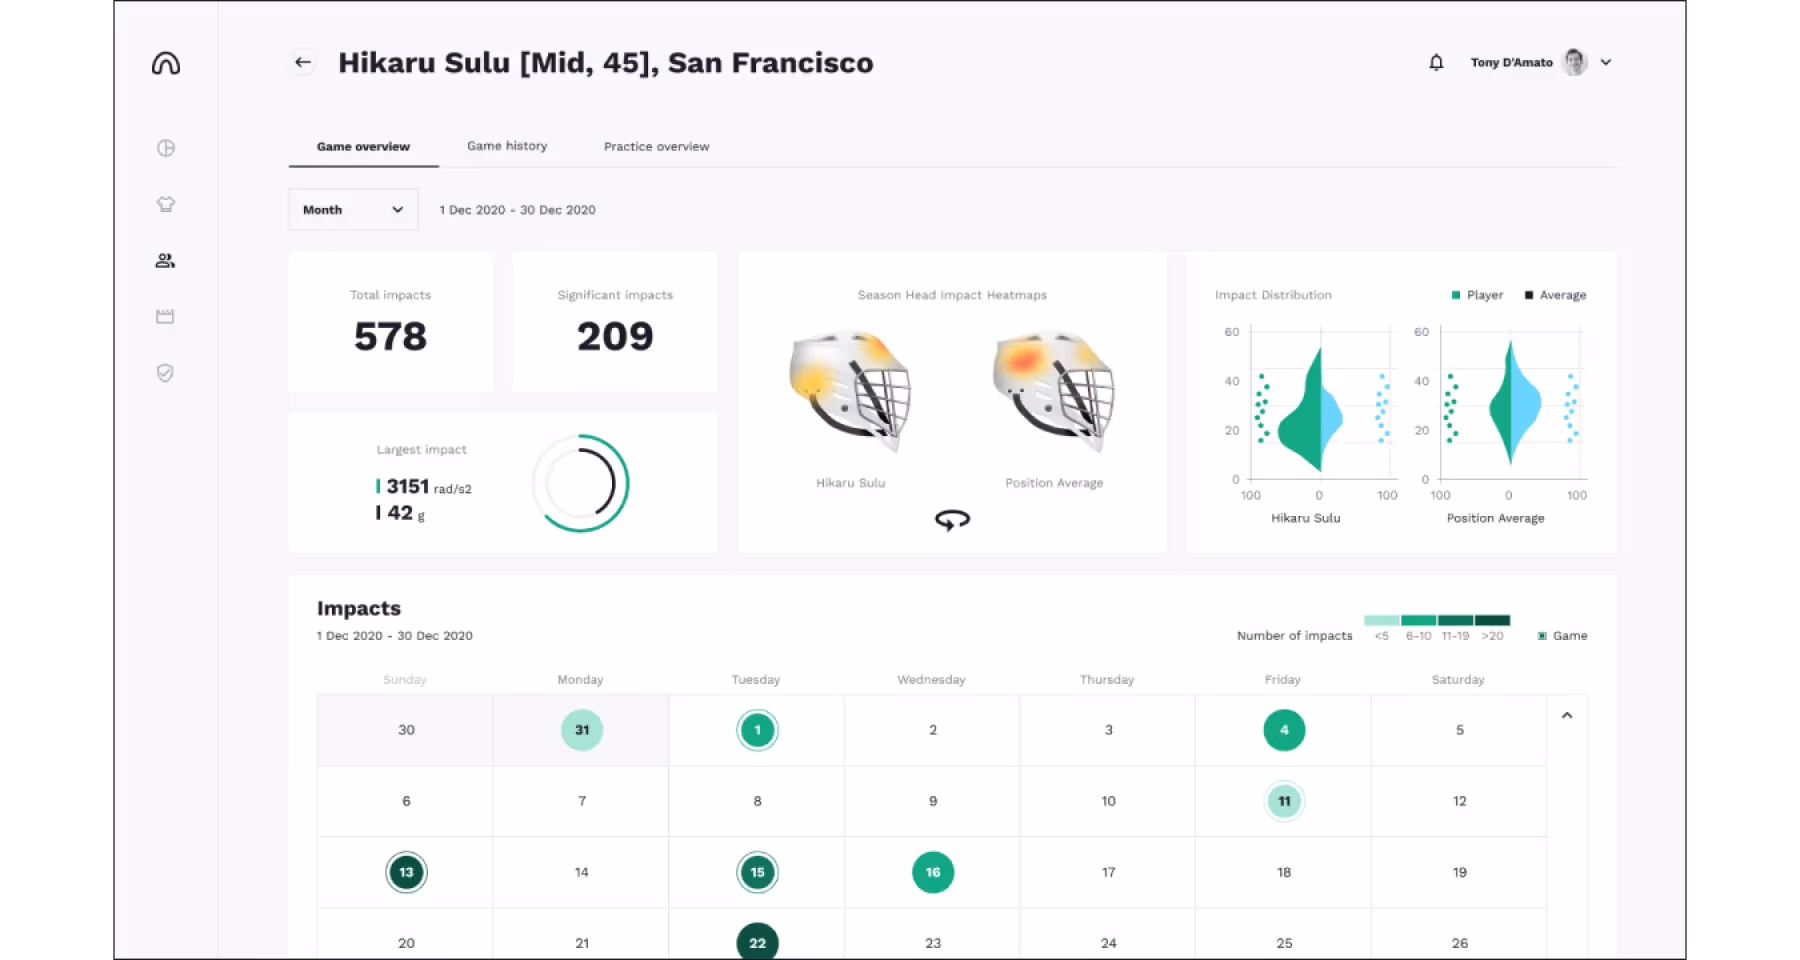
Thinking about the daily work of researchers, we integrated advanced data plotting techniques such as violin plots and 3-D heatmaps. Colors, in turn, served to accentuate the important data in the graphs, increasing their comprehensibility.
From the visual standpoint, it was also crucial to enable multiple views as per user needs (e.g., week, month, and year views, game views, and views with breaks). Not all users had equal access levels to the data, so we introduced a read-only functionality for secondary users. Additionally, data export options to different formats facilitated knowledge sharing and information presentation. Users may narrow the data scope via filtering components.
The end product lives up to the specialized users’ functional expectations in terms of data presentation, usability, and scalability. Machine Learning algorithms process the sensor data transmitted to the cloud, producing impact readings invaluable for the researchers. This information serves to create highly functional sports equipment that protects athletes, raising the bar even higher for their safety and health.
The most critical upside for biomechanical engineers using the product is data analysis at four times the speed of their earlier workflow. Before creating the app, engineers had to rely on manual data input, which slowed them down. Consolidating the video and sensor data and insights from our data analysis platform in one location allows these users to accomplish their work much more efficiently. In addition, the slow-motion playback functionality combined with zoom, especially favored by users, provides the level of accuracy needed to validate impact data. The product is also ready for subsequent modifications thanks to its scalable, future-proof design with reusable components. The client’s team currently participates in related projects with Merixstudio, continuing the fruitful cooperation on both sides.


“We are extraordinarily grateful for their support, as we would not have launched on time without them."
The view enables users to verify the sensor readings, identifying the faulty ones that need some corrections. Validated data is crucial for further analysis and processing.
A custom-made player enables researchers to zoom in on the video, jump between frames, and change camera angles per specific needs.
Users can export the data from graphs to SVG files and share them with other researchers or interested parties.
When accessing any view with the use of specific filters, tabs, or accordion extensions, users can share the same specified visuals with others in the exact same form as they see it. This is a significant time gain, as recipients do not need to readjust the views to match the software state
.svg)
.svg)
.avif)

.avif)
.avif)
.avif)
.svg)


.svg)