.svg)
.webp)
When you think of Docker probably two terms come to your mind - images and containers. If you are building a lot of images, you will most likely get a “no space left on device" error which can be especially painful if you have to do something fast. Well if you are not running “docker system prune” every now and then, there is a solution that will allow you to build more images without buying a new hard drive or additional space on your storage server. You probably don’t want to pay extra dollars for your storage but don’t worry - there is no point in doing that. The mighty multi-stage builds come to the rescue.

What’s the deal with multi-stage builds in Docker?
First of all, it pays off to know that each instruction in the Dockerfile adds a layer to the image but once the instruction is done, you don’t need the source files that it used, you just want their result. For example, let's take the frontend files and the whole node_modules directory. Because of all the requirements it can be really big, but you just need to generate styles and js once. There will be no need to keep dependencies because you are not going to use them in the future. Node_modules are a good example of a big directory of unnecessary files post-usage.

Heaviest objects in the universe. Source: Reddit
💡 MERIX TIP:
What to do with multiple Docker Hub images?
You can and should use multiple FROM statements in your Dockerfile. Each of them can have a different base, for example one can inherit from a Python image, and another from Node. When using multiple FROM statements, each of them will be a separate stage of the build.
Other pros of using the multi-stage builds include these:
- All the logic is in a single Dockerfile
- You get faster deployment
- You can benefit from improved runtime performance
For more information about the topic of multi-stage builds, read this article.
Lighter images - first steps on how to achieve them
Another great idea to save space and time in Docker is to use lighter versions of base images. Instead of using a Python image based on Debian, we could use their more lightweight version or even Alpine-based version, and reduce our images size by multiple.
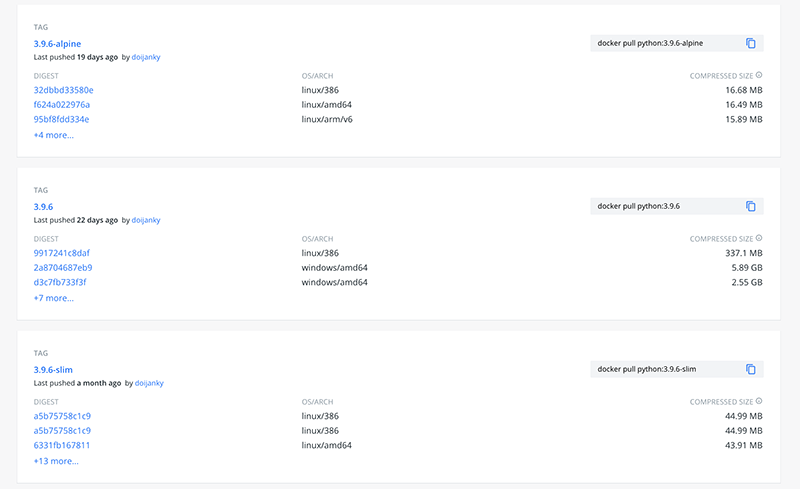
Difference in size between the versions of images from DockerHub. Source: DockerHub
It is worth remembering that various base images hold different benefits. What’s the difference between various base images then? Well, the main difference is that all of them are based on different releases. Almost all of them are based on Debian, except Alpine which is an operating system built specifically to be used inside of containers. Actually, as one of the smallest operating systems, it’s one of most popular choices for such cases. Ok, so we've established the potential of using various image bases from different operating systems. However, beware, you may need to work on these a little more to see the full effect of Docker.
Further work - slimming down the images
It may be a challenge to keep the functional side intact while limiting the impact large resource have on Docker. To achieve a good compromise between small size and functionality, use either the “slim”, “slim-stretch” or “slim-buster” version.
💡 MERIX TIP
How to keep track of image sizes in Docker?
By using docker history [OPTIONS] IMAGE, you can check what each line in the dockerfile brings to the overall size.
Limiting request numbers
When we have our image small and already running on our designated server nothing should go wrong, right? No, it still can go south, but there are some solutions that will allow you to handle problems faster.
Most likely, you are already using Sentry (or any other software) to track errors that developers have made in the code. But what about other problems like the number of requests. Let’s say your app just exploded with a number of requests and your server isn’t handling it too well. By too well I mean that Docker is shutting down and restarting every now and then. You know that logging errors are important, but you might be wondering how to prevent them with Docker? Probably the easiest and most popular method of looking at what's going on inside our container is to use “docker logs”.
💡 MERIX TIP
How to check what's going on within your Docker service?
For Docker swarm, you can check your service logs through the “docker service logs <stack_name>_<name_of_service>”.
Okay, so what's going on with the docker logs? By default, Docker shows the command’s output just as it would appear if you run the command interactively in a terminal, so both STDOUT and STDERR will appear. This output can be forwarded to remote destinations or saved in file on your server or even database. So, that way you can always look at what was happening with your container.
Because of its complexity Docker already includes many logging mechanisms to help you collect all the information from running containers or services. By default those systems are called “logging drivers”. Every docker demon has its own driver, but it can be overwritten as you see fit. This default driver will save everything in the json file.
💡 MERIX TIP
How to prevent the json file from bloating?
Keep in mind that the json file can get bigger and bigger and, if you don’t want to run out of space (or pay more for that space), don’t store the whole application history in that file.

Useful options for docker logs
Docker logs can be a big “wall” of information, so there are few options that will allow you to have better control over what you really want to see.
- Tail option
Output of docker logs will show you all logs starting from the beginning, and if your application is running for a long time, this may be a really big payload which will take some time to print. In such cases, the “--tail” option comes with help.
$ docker ps
3423df635307        docker/getting-started   "/docker-entrypoint...."   About a minute ago   Up About a minute   0.0.0.0:80->80/tcp   priceless_bardeen
$ docker logs 342 --tail 5 (yes first 3 characters of container id is enough to identify it)
2021/07/31 22:47:58 [notice] 1#1: start worker process 33
2021/07/31 22:47:58 [notice] 1#1: start worker process 34
2021/07/31 22:47:58 [notice] 1#1: start worker process 35
2021/07/31 22:47:58 [notice] 1#1: start worker process 36
2021/07/31 22:47:58 [notice] 1#1: start worker process 37
$ docker logs 342 --tail 2
2021/07/31 22:47:58 [notice] 1#1: start worker process 36
2021/07/31 22:47:58 [notice] 1#1: start worker process 37
- Follow option
Another useful parameter to use is “--follow” (or shorter “-f”). This is really useful to follow outputs and see what is going on at that specific moment. It will remain working till you break it. There are also other handy options available so if you want to see what they are, go to your terminal and just run:
$ docker logs --helps
Configure the default logging driver
Changing your configuration will require some changes in demon.json and as you know, after that you need to restart Docker and all currently running containers as well… Okay, you can skip containers if you don’t need those changes to be applied to them.
As you already know by default our logs are saved in a json file, but where can we find it? It’s simple, just run Docker inspect on your container and you will know the rest:
$ docker inspect --format='{{.LogPath}}' 342
/var/lib/docker/containers/3423df63530715686f78192eeed15253df17780eeee6c78679dc5476eab279be/3423df63530715686f78192eeed15253df17780eeee6c78679dc5476eab279be-json.log
By default, the file size will be set to 100Mb but if it’s too big, we can always change it using “log-opts”. In our case, the file size isn’t 100Mb, our logs will appear in 5 files, each of them with a maximum size of 20Mb. Why is that? Well, as we have limited space, we need to rotate these files to be able to always keep new logs. The oldest ones will always be overwritten first. If 100Mb of space is of value to you, we can simply change that. Let’s say we want to use only 25Mb of space for keeping logs. But let’s keep 5 file rotations. If storage size is not a concern for you, you can even set the “max-size” to be in Gigabytes.
{
  "log-driver": "json-file",
  "log-opts": {
    "max-size": "5m",
    "max-file": "5",
    "labels": "small_log_config",
  }
}
If you are running multiple containers, you can use your demon.json as a default config, and from that continue with custom configuration for each container. You don’t want to log anything? No problem, just set it by adding the --log-driver none to your container startup. Logging drivers may include plugins, so you can customize it even more than just by using standard logging drivers. If you want, you can write and share your own plugins via Docker Hub.
💡 MERIX TIP
How to verify which parts of your app use most of the resources?
To see which part of your app uses most resources, use “docker stats”. They will show a live stream of resources used by each container (including CPU, RAM, network and block I/O).
Wrapping up
The idea behind writing this tutorial was to highlight the main points there are to know when fixing performance issues in Docker. Each of the steps mentioned above is a good starting point for your work concerning Docker improvements. Their main benefit is that they can help you achieve a better configuration and contribute to improved performance of your application. Worth trying, isn’t it?
Would you like to use Docker in your projects? Check out our career opportunities and join us!


Navigate the changing IT landscape
Some highlighted content that we want to draw attention to to link to our other resources. It usually contains a link .
.svg)
.svg)
.svg)
.avif)

.avif)
.avif)
.avif)