.svg)


Performance tests are designed to check the ability of server, database, and application to perform under load. Test scripts are written based on usage scenarios. In test scripts, we define the number of users who are going to perform certain actions on the website.
Performance testing is often associated with the concepts of Load testing, Stress testing, or Endurance testing. In fact, these are not terms that can be used interchangeably, and Performance testing should be treated as a higher-level category, containing all the aforementioned types of tests.
What is JMeter?
JMeter is currently the most popular free tool for performance testing. Its first version was presented over 20 years ago, while the latest version of Apache JMeter ™ 4.0 was published on February 11th, 2018, and changed the game not only due to offering full support for Java 9 but also thanks to taking the user experience aspect into consideration. Dark background (Dracula Theme), using English as the default language, as well as easier navigation and creation of tests are undoubtedly a plus.
The performance test at JMeter has a complex architecture, uses ready-made components, and allows you to extend functionality through plug-ins. It can consist of such elements as Thread Group, HTTP Request, Sampler, Processor, or Listener.
I am going to present JMeter's operation on the example of testing a plan to test a website. To construct the test plan you’re going to use the following elements: Test Plan, Thread Group, HTTP Request Defaults, HTTP Cookie Manager and HTTP Request.
JMeter installation
First of all, you should start by installing a 64-bit JRE or JDK environment. You can download the binary file from the Apache JMeter page, move it to the preferred location, and then extract it. To run JMeter, run the jmeter file, which you can find in the bin directory. After a short time, the JMeter GUI mode should appear. GUI mode should only be used to create a test script, while the non-GUI (Command-line) mode should be used for load testing.
How to create a performance test
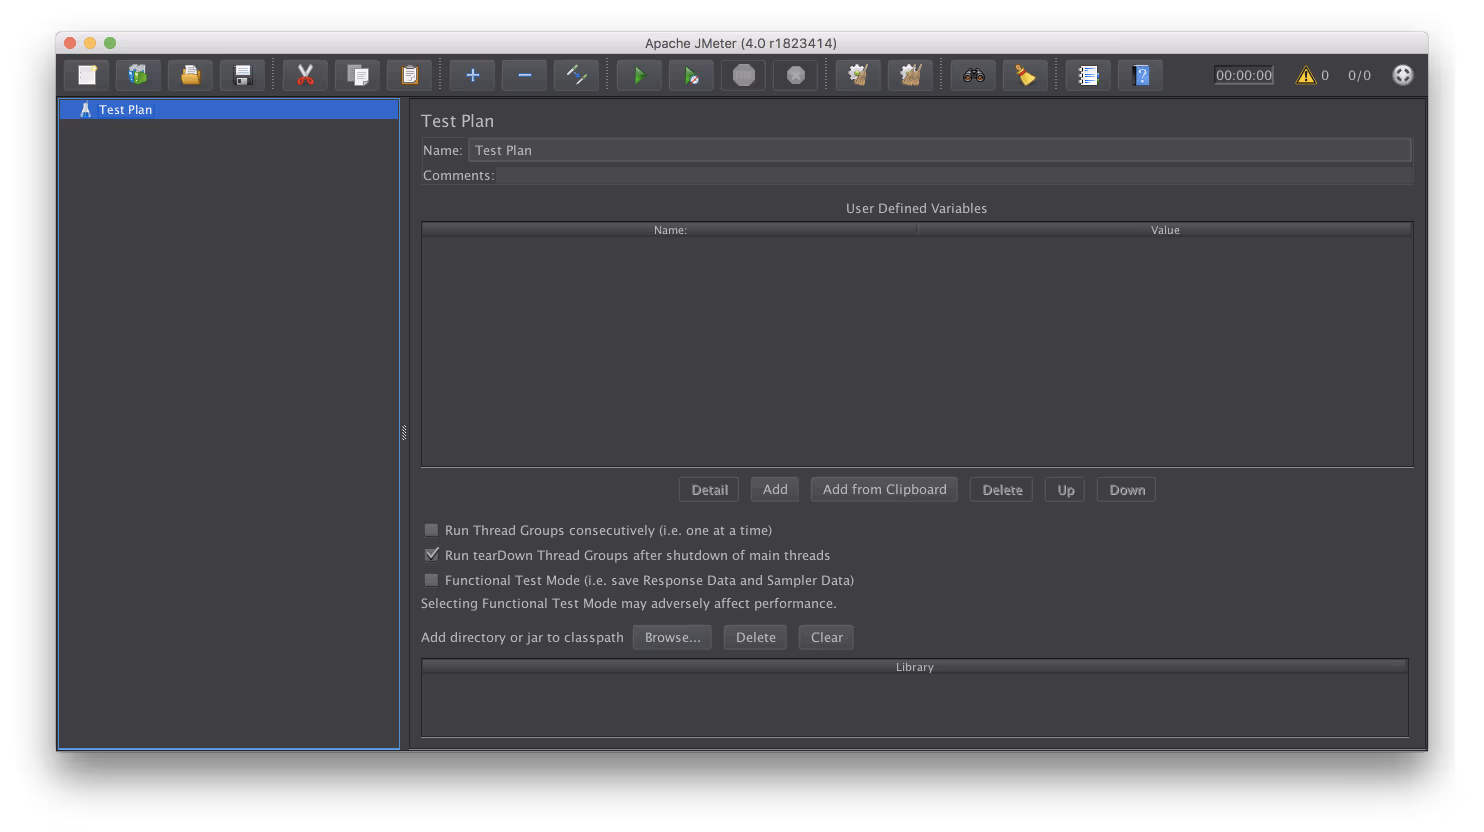
To create a performance test, you first need the Test Plan, which is the most important element of test architecture in JMeter. It describes the steps established on the basis of the usage scenario - JMeter will execute and run them.
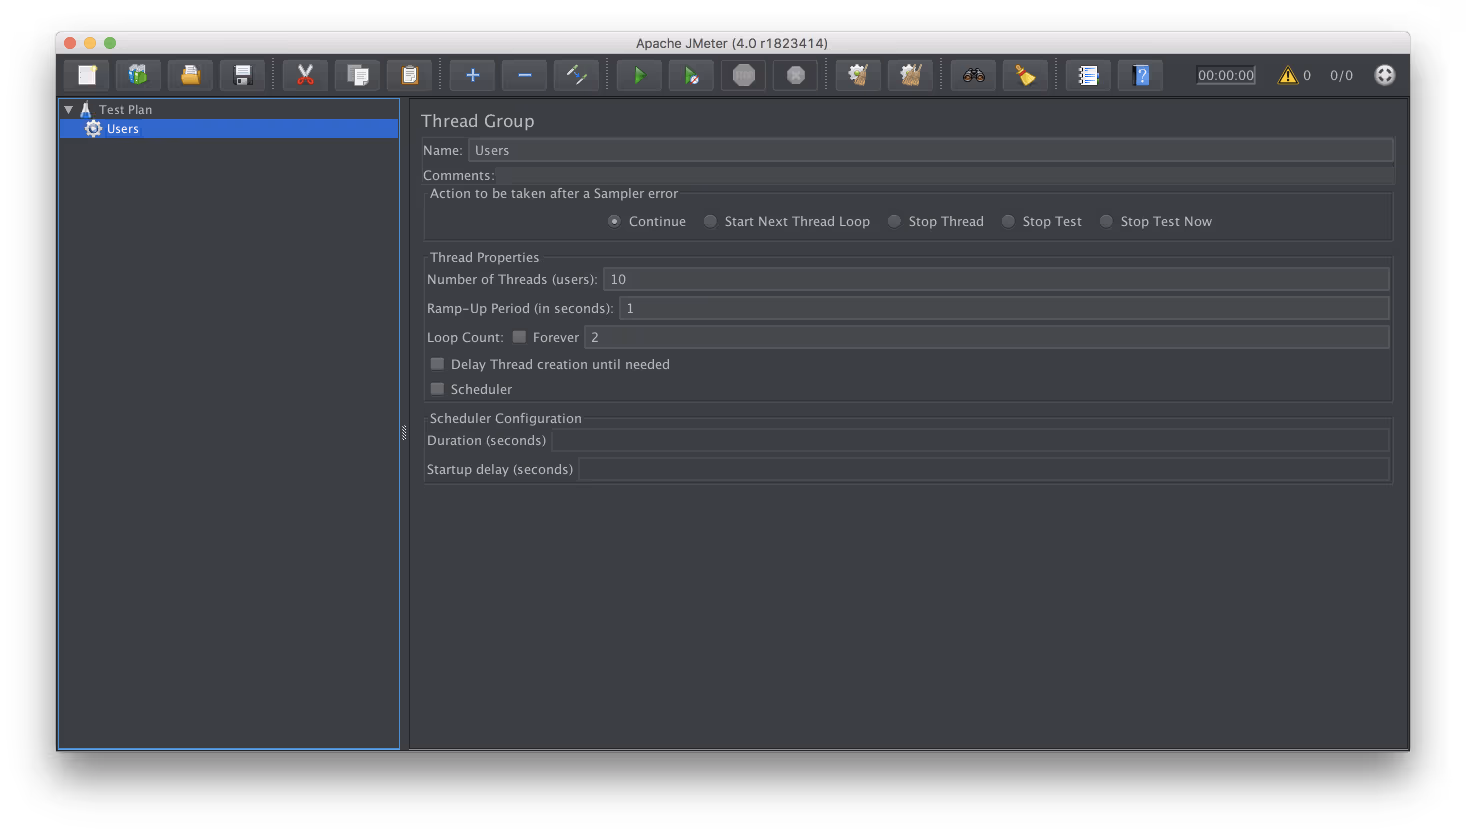
There must also be at least one Thread Group element, which is an essential part of every Test Plan. It allows you to specify the number of users that will send a specific query. To add a Thread Group element to the Test Plan, right-click, select Threads (Users) from the Add menu, and select the Thread Group option. The element should be placed under the parent Test Plan.
In the next step, you should change the default values to those that were specified in the scenario. It is not necessary, but you can start the edition by changing the default name "Name: Thread Group" to a more descriptive example, such as "Users".
In the following example, I created 10 users who will send a request to one subpage.
Let's move to Thread Properties and change the value of the first Number of Threads (users) field to 10, which is the number of users in your scenario. For the Ramp-Up Period (in seconds) field you need to leave the default number 1, which tells JMeter what the value of delay between running subsequent users is. The last value is the Loop Count - here you have to give the number of repetitions of our test, i.e. 1.
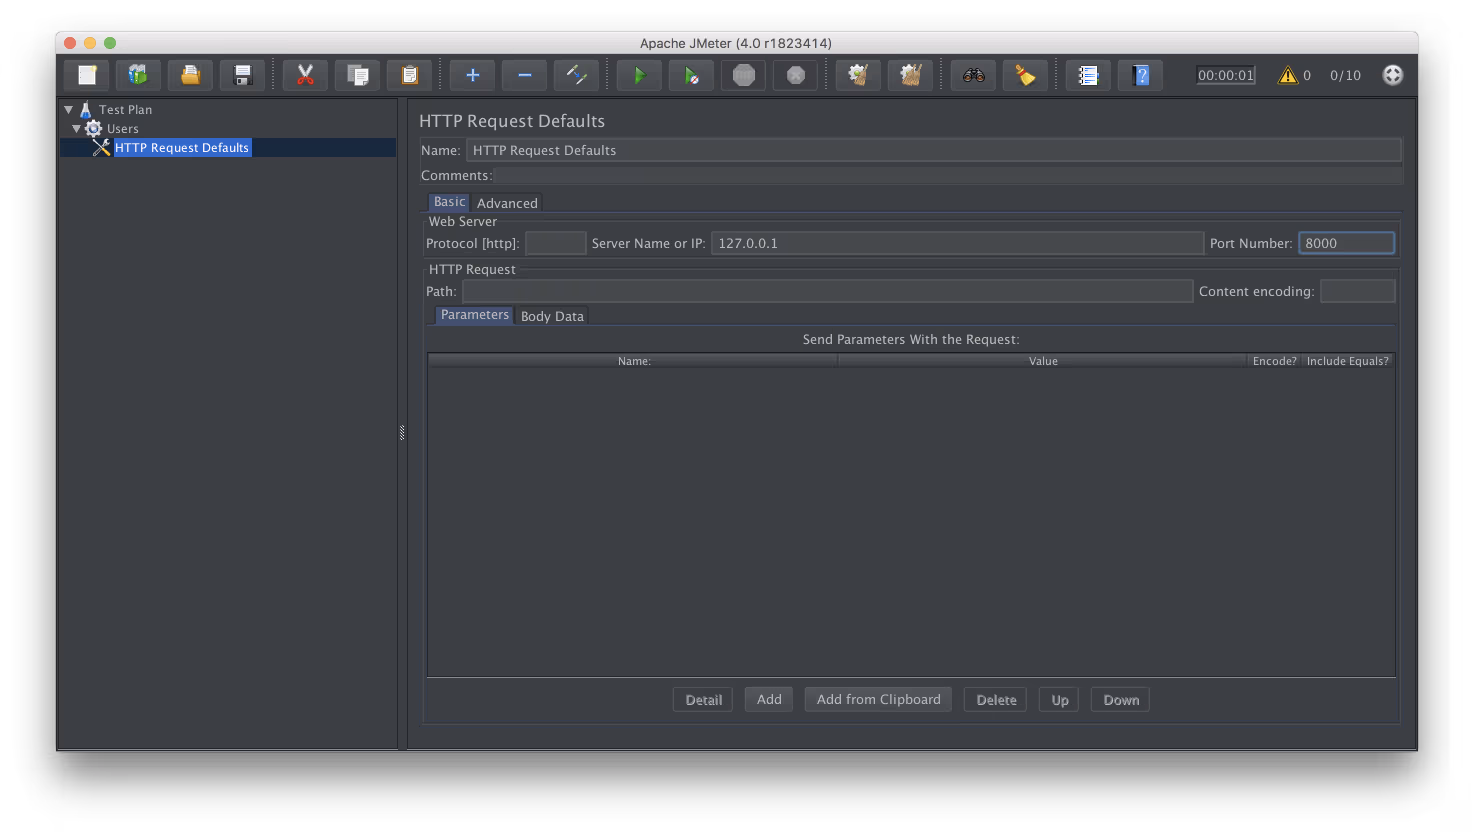
The next step is to add tasks that users will perform. You model it by selecting the HTTP Request Defaults element, which you add to the previously created Thread Group named Users. Click it with the right mouse button, select Config Element from the Add menu, and then add the HTTP Request Defaults element.
The HTTP Request Defaults element is not used to send HTTP requests, but to define values that will be included in it. Add server name in the added view, which in our case means putting 127.0.0.1 in the Server Name or IP field, as well as the port number, (8000) in the Port number field. All HTTP requests now will be sent to the same web server.
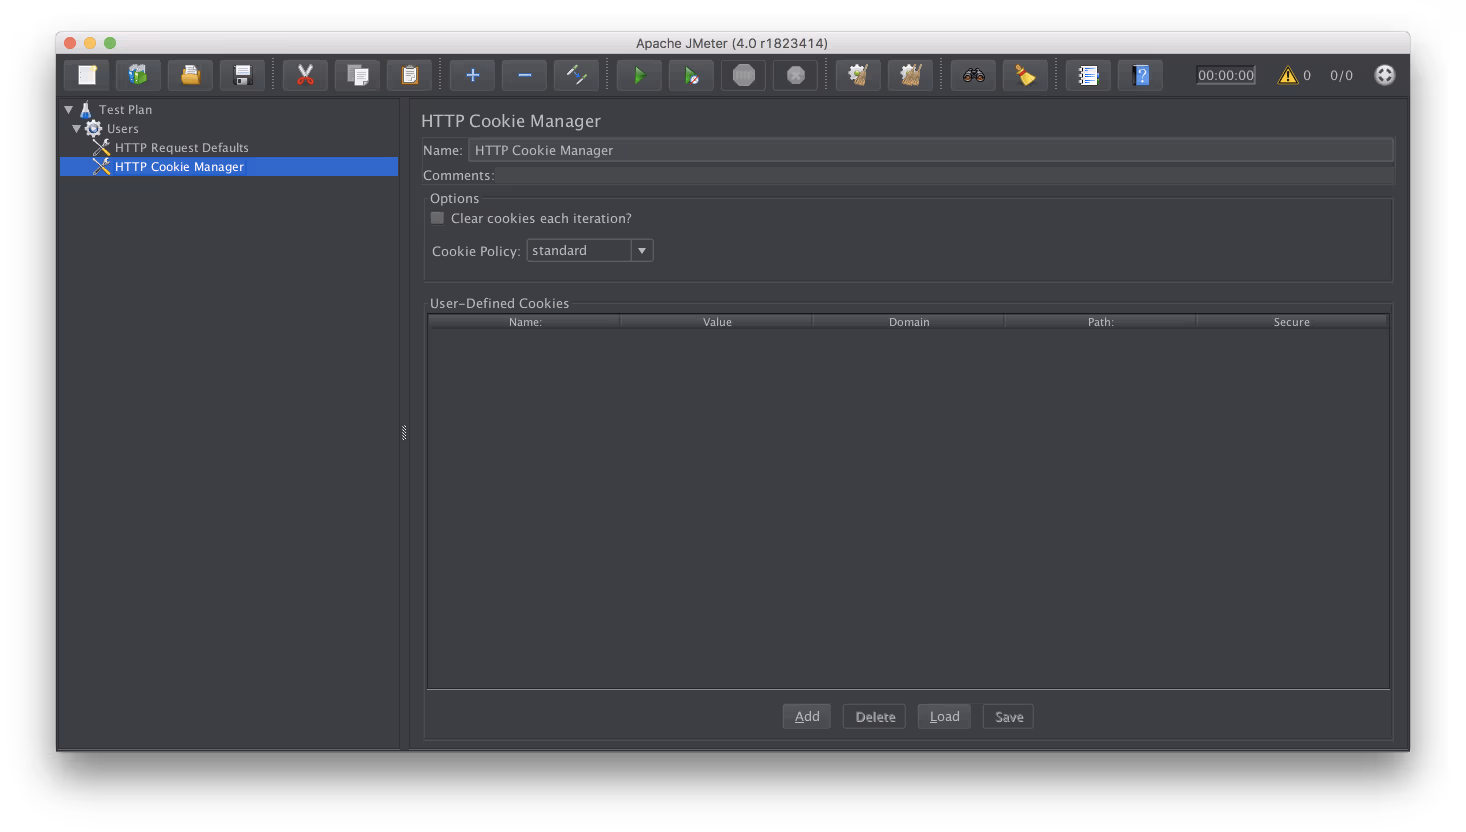
For your web performance test, you can also add cookie support. Add the HTTP Cookie Manager element to Thread Group (Users) by clicking on it with the right mouse button, selecting two elements: first the Config Element from the Add menu, and then the HTTP Cookie Manager. Don't worry about the specific values - you can leave the default ones.
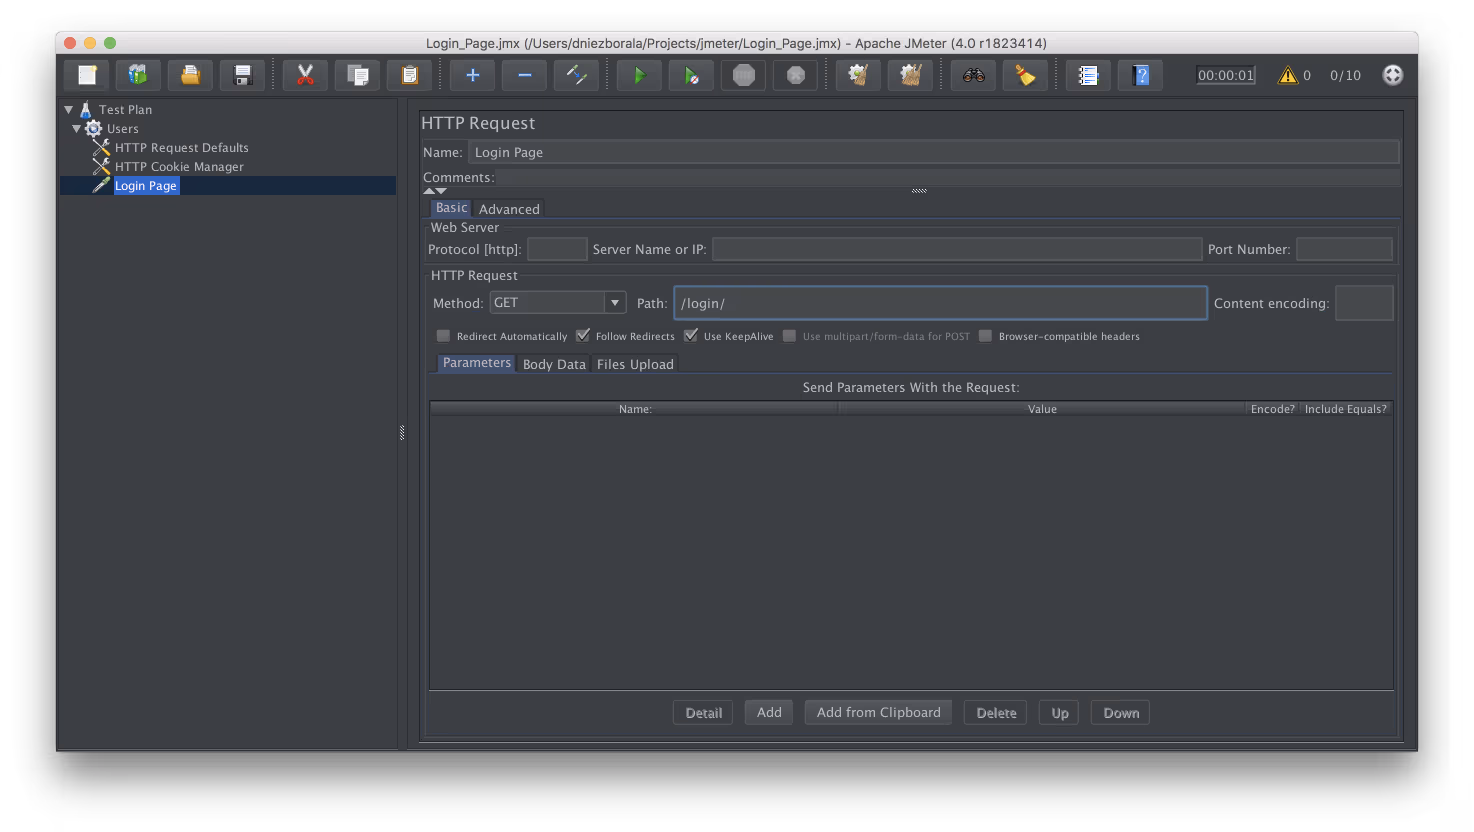
The test still needs HTTP Request. In the case of your scenario, there will be one query, which will apply to the Login Page page. You need to add the HTTP Request element to the Thread Group (Users) via the Add -> Sampler menu. For HTTP Request, you can change the value of the Name field to a more descriptive one, e.g. Login Page. Go to the Path field and insert / login /. At this point, there is no need to put the web server address - you have already done this in the HTTP Request Defaults element. The remaining values have to be left as default.
In the Test Plan, you can also place a listener, i.e. elements that allow you to analyze the test results, for instance in the form of a table or a chart. It is recommended to use listener only when debugging because they can consume a lot of memory and thus break results.
Want to know more? Check out User's manual and JMeter project on Github!
What is Locust
Locust is a framework for writing performance tests in Python and one of the many alternatives to JMeter. It allows you to write performance tests in Python, and its implementation is based on tasks. It is designed for testing websites and systems and allows you to check how many simultaneous users they will handle. You can disperse your tests between many machines and check their results in the shared graphical interface.
Installation of the Locust framework
Locust can be installed on any operating system: MacOS, Windows, or Linux. Below is an example for MacOS, in which the installation can be done using the PIP package manager.

Creating a performance test
Below is an example of a simple script saved as a file with the .py extension. The default name of such a file is locustfile.py
from locust import HttpLocust, TaskSet, task

class LoginPage(TaskSet):
 @task
 def login_page_with_response_code_assertion(self):
 r = self.client.get("/login/")
 assert r.status_code is 200, "Unexpected response code: " + r.status_code

class LoginUser(HttpLocust):
 task_set = LoginPage
 host = "http://127.0.0.1:8000"
 min_wait = 1000
 max_wait = 5000
In the file, you defined the so-called Locust task (can be more than 1) by using the @task decorator. In tasks, you define user behaviour on the website. HttpLocust, in turn, represents the user, and in it, you define how long the user should wait for the execution of the tasks.
To run the test saved as locustfile.py, in the terminal you have to go to the directory in which it is located, and then enter the following command:
locust --host=http://127.0.0.1:8000
In the next step, you can run the graphical interface in the browser, which is located in http://127.0.0.1:8089 (in our case Locust is running locally).
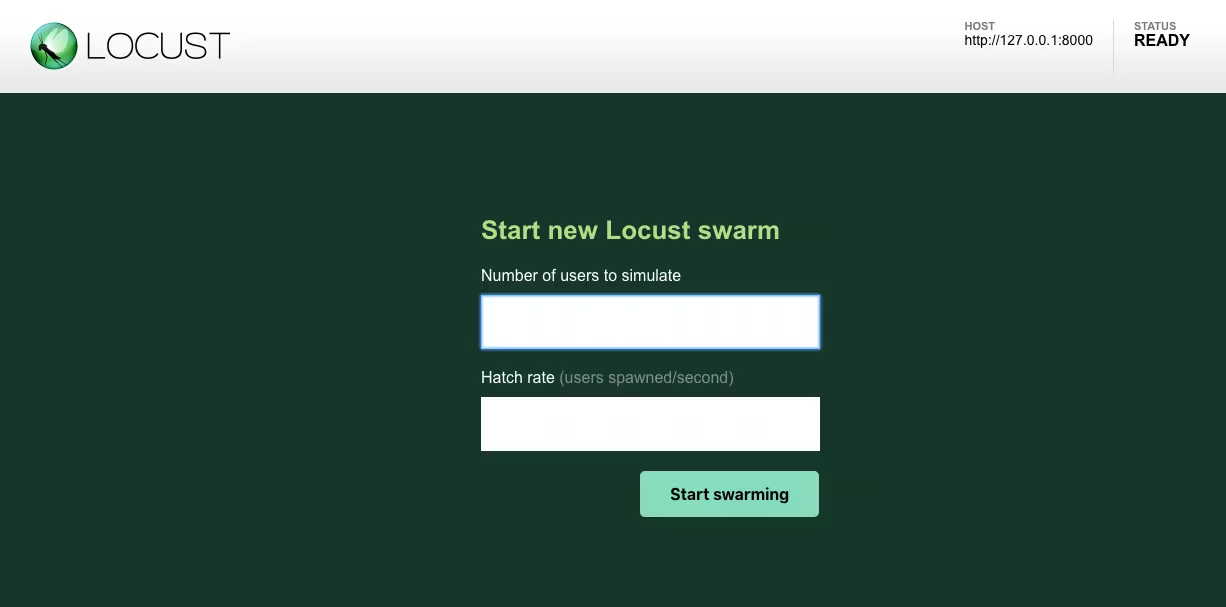
The interface will open on the page with two inputs. In the first of them, "Number of users to simulate", we have to enter the number of users (e.g. 10.0). in the second one, "Hatch rate", you specify the number of users that will be created in a second (e.g. 1). When running a test with given values, you will see test statistic.
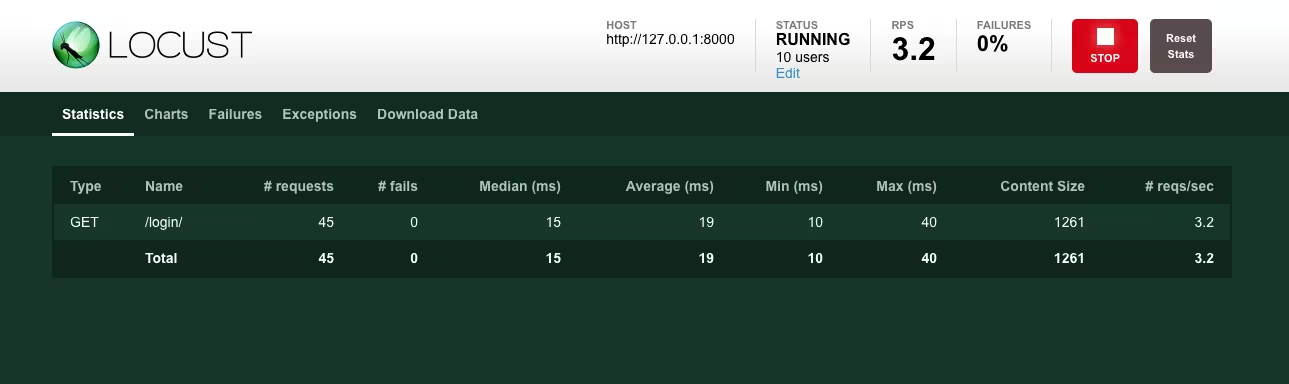
In addition to the statistics, you can also see a graph or download statistics in a CSV format.
Once again, if you want to find out more about Locust, check out its official documentation and profile on GitHub.
So, which one you should choose?
In summary, the choice between JMeter and Locust is definitely not easy. Although both tools are open source, behind the JMeter is the giant in the form of The Apache Software Foundation. On the other hand, Locust is being developed by a small team of developers and the community centred around the tool. The test in JMeter is based on the elements of Thread Groups. To simulate many users, you must add the appropriate number of these elements.
Also, JMeter is a 100% application written in Java, while Locust is based on Python, which is a language that makes writing tests possible. This distinction is important because in the case of writing advanced assertions with JMeter you can do it by using Java, Groovy, or Beanshell, while Locust is Python in the purest form. Starting with Performance testing might be easier with JMeter, especially if you don’t have much experience in creating performance tests and you prefer create UI tests. For more experienced testers, who know Python, writing tests using Locust might be more comfortable.


.svg)
.svg)
.svg)
.avif)

.avif)
.avif)
.avif)