.svg)

Canvas – a few words of introduction
It’s 2001 and SVG (Scalable Vector Graphics) comes to life. It's an open standard for describing vector data in XML format. Its declarative format allows to create a file which will store the information about what we want to see:
<svg height="100" width="100">
 <circle fill="black" stroke="red" stroke-width="3" cx="50" cy="50" r="40" />
</svg>
The SVG file can be modified with lines, curves, circles and many other mathematical elements. It goes like that: we don't specify "I'll draw the line, an the the circle", but clarify “This line goes here, and this circle goes there”. And what if we want to build up the scene consisting of hundreds or thousands elements? Describing every one of them would be a hard labor. Luckily, canvas was born in 2008 and became the answer for this problem.
Canvas time to start!
Canvas is officially “an element, which may be used to displaying or rendering the graphics, games’ graphics or other graphic elements on the fly”. In other words, it allows dynamic rendering of lines, shapes, texts, gradients, bitmap images and other effects, using JavaScript and canvas 2D API.
Additionally, canvas, supported by WebGL technology, is able to create 3D graphics using graphics’ card acceleration.
Canvas works thanks to JS, but firstly we have to declare <canvas> tag with id attribute in the HTML code if we want to refer to it later in our script.
<canvas id="nasz_canvas" width="400" height="200"></canvas>
After referring to our element in JS code we also have to invoke to its drawing context. This is where our graphic work will be created. Every canvas element has its own context, so if we have many of them we have to refer to each context individually.
<canvas id="nasz_canvas" width="400" height="200"></canvas>
<script type="text/javascript">
 var canvas = document.getElementById("nasz_canvas");
 var context = canvas.getContext("2d");
</script>
How it works?
We’re working in canvas on coordinate system which has its beginning (0,0) in the left upper corner. We take one pixel as the unit. To illustrate the way of converting coordinates I prepared the following model which presents our coordinate system (in this case, fragment 20x10 pixels).
See the Pen Base grid by Anita (@smotchi) on CodePen.
I created functions in order to make my work easier and to present step by step what happenst:
function addCircle(x, y, r, color, hideRadius) {
 x = x*step;
 y = y*step;
 r = r*step;
 context.beginPath();
 context.arc(x, y, r, 0, 2 * Math.PI, false);
 context.fillStyle = color || 'rgba(20,175,40,1)';
 context.fill();
 if (!hideRadius) {
 context.beginPath();
 context.moveTo(x, y-r);
 context.lineTo(x, y);
 context.lineWidth = 1;
 context.strokeStyle = '#ffffff';
 context.stroke();
 }
}
function addText(x, y, text, align) {
 context.beginPath();
 context.font = '9pt Calibri';
 context.fillStyle = 'black';
 context.textAlign = (typeof align == 'undefined')? 'left' : align;
 context.fillText(text, x*step, y*step);
});
2D API has the possibility of creating basic shapes, so-called primitives. These shapes are described here. This site has all functions of the API described and supplemented with examples – I highly recommend adding it to bookmarks.
In my opinion, the hardest thing to understand in canvas are transformations: translation, scaling, rotating and others. This is the main reason I created this mockup. Transformations don’t interact directly on the added primitive, but on the whole canvas element. If we add two circles and we want to rotate one of them, we have to type:
 drawGrid();
 addCircle(2, 2, 2, 'rgba(255,0,0,0.7)');
 rotate(Math.PI / 4) // rotation in radians value
 addCircle(2, 2, 2, 'rgba(0,255,0,0.7)');
which results in:
See the Pen Example 1.1 by Burger (@Burger) on CodePen.
You can see that our circle was rotated, but it is not what we expected. I suggest to render the grid of our coordinate system after the transformation again and check what happened.
 drawGrid();
 addCircle(2, 2, 2, 'rgba(255,0,0,0.7)');
 rotate(Math.PI / 4) // rotation in radians value
 drawGrid();
 addCircle(2, 2, 2, 'rgba(0,255,0,0.7)');
See the Pen Example 1.2 by Burger (@Burger) on CodePen.
All it's clear now! The transformation made the whole coordinate system rotate in our (0,0) point. Let’s fix our code and display both circles a bit further from the border, then let’s make the rotation based on the center of our second circle. Firstly, we have to translate our coordinate system to the center of the first circle, rotate the whole system and then place the second circle in (0,0), because this point is in the middle of the first circle.
 drawGrid();
 addCircle(4, 4, 2, 'rgba(255,0,0,0.7)');
 translate(4, 4);
 rotate(Math.PI / 4) // rotation in radians value
 drawGrid();
 addCircle(0, 0, 2, 'rgba(0,255,0,0.7)');
See the Pen Example 1.3 by Burger (@Burger) on CodePen.
If we want to insert more objects to the context, we should 'reset' it before actually adding them, because every new element will be added to already rotated coordinate system. We may rotate and translate it using negative values, but that way of solving this problem will not work for high numbers of transformations and should never be used. We should use matrix transformation to reset the system.
context.setTransform(1, 0, 0, 1, 0, 0);
We can also save the current state of the transformation. Thanks to that, we can make the next modification and return to the saved state when we need. The save() function saves the current state of the drawing and stores it on the stack. Since this moment we can make another transformation remembering that it will be performed based on the current state - if we translated the view 3 units to the right, the next transformation right 4 units will result in moving elements 7 units right in total. To illustrate it:
See the Pen Example 1.4 by Burger (@Burger) on CodePen.
Why do we actually need states? Let’s assume that we drew 3 squares and we want to rotate each of them by a certain angle – the second one will be rotated by a larger angle than the remaining two. What we have to do is to save the first rotate to the stack, add the first square, make yet another rotation, insert the second square, restore the saved state and add the last square. The restore() function sets up the last staked state and deletes it from the stack. After these commands, our canvas should look like that:
See the Pen Example 1.5 by Burger (@Burger) on CodePen.
These are the steps we have to take:
- Translate the context right 4 units
- Rotate the context by more or less 25 degrees
- Stacked the state
- Add the first square to point (1,1)
- Rotate the context by 30 degrees
- Add the second square in point (1,1)
- Restore the saved state
- Add the last square in (1,4) in order not to hide the first one under this one
Let’s translate it to our favorite language:
 translate(4,0);
 rotate(Math.PI / 7);
 context.save(); // save the state on the stack
 addRect(1,1,3,3,'red');
 rotate(Math.PI / 6);
 addRect(1,1,3,3,'blue');
 context.restore(); // restore the saved state - transformation (4,0), rotation (Math.PI/7) and delete from the stack
 addRect(1,4,3,3,'purple');
I made the animation presenting the execution of these commands step by step:
See the Pen Example 1.6 by Burger (@Burger) on CodePen.
Let's make it move!
An animation is nothing more than a sequence of functions drawing elements on canvas. That’s why we need some kind of function that will help us draw in accurate time intervals. Since we want to match current standards, our animation should have 60 frames per second. The setTimeout function will be perfect in this case:
 function loop() {
 setTimeout(loop, 1000/60) // ~16.667ms
 render(); // function rendering a single frame
 }
Great! Now we can start animating! Well, can we? This example will work, but it has some disadvantages.
Firstly, the setTimeout doesn’t take into consideration what happens in the browser. A website can be opened in card that is not currently active (user may browse other pages) – this will result in unwanted burden our processor.
Secondly, setTimeout updates the view when it wants, not when our computer is able to do it. That means our poor browser is forced to recalculate regardless of when the screen refreshes. It requires more computing power - that means we use processor power again. The end result is the FPS drop – our animation and moving the element from point A to point B will take longer than expected.
A proper approach to animations
What should we do to reduce processor usage? The answer is requestAnimationFrame(). As the name suggests, this function informs the browser that it want to execute the animation and requests bringing on a specific function responsible for animations’ rendering before the next refresh of the screen. Our animation will run in 60 FPS only when our display will refresh with 60 kHz rate (60 times per second). Let’s update our code:
 function loop() {
 requestAnimationFrame(loop)
 render(); // function rendering a single frame
 }
It looks similar to the previous version but it misses something, doesn’t it? Well, in this case we don’t define the time interval between frames. The browser decides when it happens and it’s usually 60 FPS provided that our computer is fast enough to calculate the code in given time. But wait! If our computer is able to render only 30 FPS, our element won’t move from point A to point B in the same time as in 60-FPS-case.
That’s why we should calculating delta timing while moving the position of our element. In order to do that, we have to save the time in which the function of a single frame is made and subtract the value from the previous frame. If we want to move our element in particular way and particular time, we have to multiply received difference by the speed of the element.
 var lastFrame = Date.now();
 var speed = 10 / 3000 // distance divided by time (ms)
 var x = 2; // current position of the element

 function render() {
 var now = Date.now();
 var deltaTime = (now – lastFrame);
 lastFrame = now;

 x += speed * deltaTime; // iterating the position

 clear(); // clearing the views
 addCircle(x, 5, 0.5); // adding the element in a given position

 }

 function loop() {
 requestAnimationFrame(loop)
 render(); // function rendering a single frame
 }

 loop();
The example below based on my model presents the position and elapsed time.
See the Pen Example 1.7 by Burger (@Burger) on CodePen.
SVG or Canvas?
Vector vs raster
SVG is based on vector graphics while canvas is based on pixels. In both cases it’s possible to create lines based on the mathematic algorithm.
Files vs scripts
SVG images are defined in XML, every element is implemented to DOM (Document Object Model). Thanks to that it can be modified with both JS and CSS.
Events
Every SVG element can handle events or have its properties updated via the other event in the document. Canvas draws pixels and that’s all it does - if we want to modify it, we have to define it in the script.
Browser support
SVG has better browser assistance. Additionally, it supports text – if the browser doesn’t support SVG, it displays the text used inside. Canvas depends on JavaScript, so if we have JavaScript disabled in our browser, all we receive is a blank field. However, there’s a way to handle it. We can use <noscript> tags and then the browser will show canvas’ contents.
Efficiency
The browser may have some problems when it comes to smooth rendering of a large number of SVG elements. If we’re using Canvas, the number of elements can be way bigger than in SVG case. The biggest disadvantage of Canvas in terms of its efficiency is its size – the bigger it is, the higher processor usage it requires.
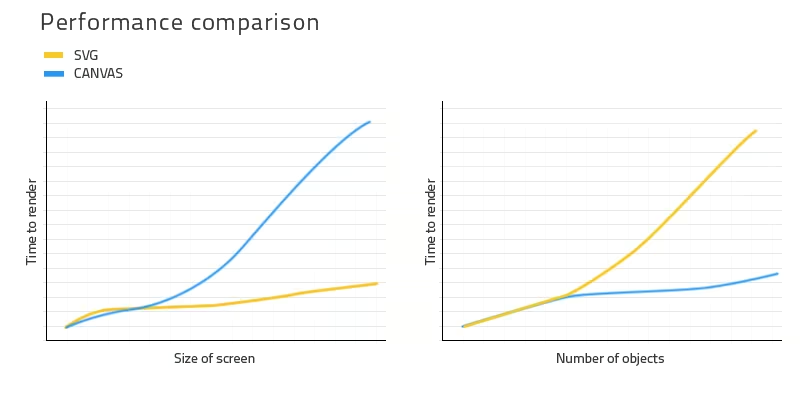
When we should choose SVG and when Canvas?
It obviously depends on the project. We should predict how large the project will become, in order to choose either SVG or Canvas. Charts below presents performance depending on the size of screen and the number of objects:
Summary
Canvas is the solution of the twenty-first century - we’re only limited by our imagination (and the computing power, obviously ;)). It allows us to create everything what comes to our minds and if we support it with WebGL, we’re able to reach even higher level. Canvas is great for developing games, such as Skytte created by us or our extraordinary Kopanito All Stars Soccer. These are examples how well new technologies can be used. One may think that developing a game is time-consuming – it’s true, but some frameworks speed up the process of games’ development. There are a few kinds of frameworks: based on WebGL (three.js), based on a standard 2D API (paper.js) and these which operate on SVG only (fabric.js). Here’s the list of the most popular ones:
- three.js
- pixie.js,
- pharser,
- raphael.js
- paper.js,
- fabric.js,
- processing.js,
- canvasjs


.svg)
.svg)
.svg)
.avif)

.avif)
.avif)
.avif)